UK inland water quality and pollution statistics
Last updated: 18 November 2012
In brief: This page records our attempt to keep track of official UK river and water quality statistics over the last decade or so. It's also our ongoing attempt to debunk official press releases that suggest our rivers have never been better; that might be true of previously filthy "urban sewer" rivers, but broad-brush, aggregated assessments present a highly misleading picture overall.
Clean or dirty?
Over the last couple of decades, the British government's environment department (currently called Defra, but renamed every few years) and the Environment Agency have sometimes been a little disingenuous about inland and coastal water quality. Great progress has been made improving water quality and all credit to the people who've made this happen. But that doesn't mean rivers, beaches, and coastal waters are absolutely pristine, full of life, and always clean enough to swim, surf, or bathe in—and we shouldn't be giving that impression.
In September 2009, for example, the Environment Agency boldly announced: Quality of Rivers in England and Wales best for over a century. Elsewhere, the same day, the story was rather different: BBC News, for example, was telling us that Most rivers fail EU standards, while The Independent was asking Why are our rivers so dirty, and what can be done to make them cleaner?. Three views of exactly the same story! The explanation? European legislation had just raised the bar considerably and mediocre UK standards were no longer good enough.
That incident wasn't a one-off: government figures repeatedly paint a picture of ever-improving rivers and beaches while conservation organizations and environmental campaigners tell a different story. Here's another example. In November 1999, Surfers Against Sewage were telling us that UK Fails Bathing Water Standards Set 33 Years Ago, while the UK government preferred to spin exactly the same story as 98% of swimming spots meet water quality standards (where "water quality standards" is another way of saying "absolutely bare minimum mandatory standards").
The point is clear: you need to treat official statistics with caution and interpret them critically. To help you, we've been archiving stories and statistics about UK water quality on this page for over a decade.
Please note that a number of files linked from this page are in PDF format (indicated by this symbol  ). Most modern computers will load PDFs automatically in a new window, but if your computer doesn't you'll need
to download Adobe Reader (formerly called Adobe Acrobat)
or one of the numerous alternative PDF readers.
). Most modern computers will load PDFs automatically in a new window, but if your computer doesn't you'll need
to download Adobe Reader (formerly called Adobe Acrobat)
or one of the numerous alternative PDF readers.
Photo: The River Fowey, Cornwall.
Current official statistics
How clean or otherwise are Britain's rivers and inland waters? If you want the most up-to-date statistics for inland water quality in the UK, try the following pages:
- EU: Water Framework Directive: Facts, Figures, Maps: On this page, you'll can find links to the latest water quality maps and data.
- Defra: Inland Water Quality: This seems hopelessly out-of-date, but there seems to be nothing newer as of November 2012.
- Scottish Environmental Statistics Online: Inland Water Quality from The Scottish Government.
2012
The key document to look at is EU: Water Framework Directive Implementation Report 2012. Once you're on this page, scroll down to where it says "Country specific assessments" and in the drop-down box, select "United Kingdom (UK) - SWD (2012) 379 Volume 29". This will download (in PDF format) a very detailed, 62-page report dated 14 November 2012 on the current status of the UK's implementation of the Water Framework Directive across all our river basin districts (RBD).
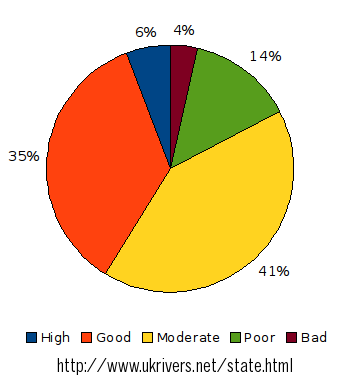
Chart: Right: How healthy are the UK's rivers? This chart shows the "Ecological status of natural surface water bodies" (including rivers) for the UK, October 2012. Source: WISE. Quoted in European Commission: Report from the Commission to the European Parliament and the Council on the Implementation of the Water Framework Directive (2000/60/EC): River Basin Management Plans, {COM (2012)/670 final}, dated 14 November 2012. As we said above, aggregated charts like this (which summarize the entire UK) aren't that helpful; it's important to study the detail for each river basin district and river. Nevertheless, it's blindingly obvious from this chart that a statement like "Quality of Rivers in England and Wales best for over a century" is unhelpful (at best) and disingenuous and deliberately misleading (at worst), because almost two thirds of the "surface water bodies" fall into the categories moderate, poor, or bad.
The report contains statistics and charts for each river basin in the UK, plus a summary (on page 4) of the current weaknesses ("gaps") in the UK's approach, notably:
- Inadequate use of biological indicators for water quality assessment: "The major gaps identified across all RBDs were mostly related to the used (sic) of biological quality elements for assessment. In some cases, methodologies for assessment of BQEs have not been developed, in others certain BQEs are not included in surveillance monitoring programmes and in some BQEs are not used for assessment even where they are monitored." (Historically, the UK has generally preferred to hide behind chemical indicators, which tell us only about chemical water quality and reveal little or nothing about what is actually living in rivers and inland waters.)
- "... limited information on the methodology to identify significant pressures."
- "The large uncertainties reported in relation to the status, the pressures and the effect of potential measures, despite the relatively high intensity of monitoring in the UK has been used to justify the inclusion of very few specific new measures." Later (on page 60), the report notes a lack of transparency and clear reporting in the identification of pollutants and (on page 61) reveals that "a large number of exemptions have been applied" without proper explanation or justification.
- "Despite agriculture being identified as a significant pressure, no new mandatory measures have been agreed in the plans. Voluntary measures listed rather than mandatory measures. Diffuse pollution from agriculture was for instance identified as a major pressure there appear to be no new additional measures to address this."
The chart on page 11 shows the number and percentage of inland waters affected by various different pressures and reveals that 68 percent are subject to pressure from diffuse pollution.
Section 6, starting on page 19, summarizes the state of UK inland waters by river basin, revealing the percentage that can be described as high quality, good, poor, etc. As you can see from the chart on page 29, virtually no "natural surface water bodies" are classed as "high" ecological quality, except in Scotland.
A list of recommendations for action for the UK begins on page 59. Agricultural pressure on rivers and inland waters is flagged up for specific attention: "Agriculture is indicated as exerting a significant pressure on the water resource in all UK RBDs [river basin districts]. This should be translated into a clear strategy that defines the basic/mandatory measures that all farmers should adhere to and the additional supplementary measures that can be financed." (page 61).
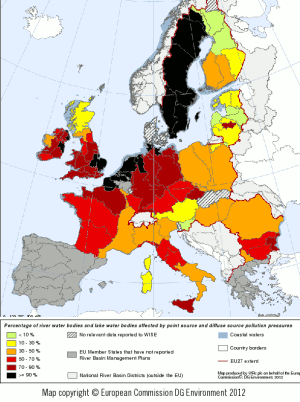
On pollution, specifically, check out: EU DG Environment: Point and diffuse source pollution: rivers and lakes (2012): This will take you to a full-sized version of the map shown on the right. Please note that this is a direct link to a large (8MB) PDF file, which will take considerable time to download on a slow (dialup or mobile/cellphone) connection. You can see from this map, which is dated 29 October 2012, that with the exception of the Scottish Highlands, the UK's rivers and lakes are almost entirely classed as 30–50% (orange), 50–70% (red), 70–90% (brown), or over 90% (black) pollution (where "pollution" means "affected by point source and diffuse source pollution pressures"). However you interpret this data, there's clearly no room for crowing about rivers that are better than they've been "for a century" or any other kind of complacency: England and Wales is almost entirely brown or black!
Chart: Right: Percentage of river water bodies and lake water bodies affected by point source and diffuse source pollution pressures. Source. EU DG Environment, October 2012.
2011
The Guardian's John Vidal has picked up this issue and written a couple of good pieces:
- How the Environment Agency has spun the news on river quality: The Guardian Environment Blog, 30 August 2011.
UK environment in great shape? Think again!: The Guardian Environment Blog, 18 January 2011.
2009/2010
We haven't been able to find really detailed figures on river quality from Defra since 2007, when the way of measuring river quality was changed to reflect the new Water Framework Directive. The most up-to-date information is Defra's river quality statistics. Be warned: sweeping, national graphs give the impression that everything is just fine with our rivers and getting better and better by the day. It's our experience that graphs covering entire countries are a good way of masking problems in individual regions or with specific rivers, so treat them with the critical eye they deserve.
For a balanced view, read these unofficial news stories, reports, and related pages:
- Tackling diffuse water pollution in England: A critical, July 2010 report by the National Audit Office concludes: "The Environment Agency's approach to tackling diffuse water pollution, such as run-off from agricultural land, has not, to date, proved value for money. The development of River Basin Management Plans now offers an opportunity to target work by the Agency and others to tackle this complex problem.".
- Most rivers fail EU standards: Three quarters of English and Welsh rivers fail to meet the new EU standard of "good" quality. Only five of 6000 rivers are classified as pristine.
- RSPB calls for action over "worrying" rivers: Just five of the 6,000 rivers in England and Wales remain in pristine condition, according to new figures published today, and RSPB is demanding action.
- Why are our rivers so dirty, and what can be done to make them cleaner?: The Independent has a wonderfully clear and simple guide to the latest scandal over river quality, by Amol Rajan.
- Rivers in the UK: Despite buoyant government figures, WWF report that "only 15% of the total length of our rivers are healthy enough to support a vibrant ecosystem".
- 200 polluted rivers in Northern Ireland: BBC News story from December 2008.
2006
The figures for 2005 were published in this Defra news release from 17 August 2006. It referred to the following charts, which showed broad (and generally very encouraging) trends for the whole country, but they also disguise a few other (worrying) trends in particular regions (notably Anglia).
- Chemical river water quality to 2004
- Biological river water quality to 2004
- Phosphate concentrations in rivers to 2004
- Nitrate concentrations in rivers to 2004
- Water pollution incidents to 2004
- Water leakage to 2004
- Water abstractions to 2004
- Drinking water quality to 2004
We have also produced some of our own charts using DEFRA's data in e-Digest Statistics about: Inland Water Quality and Use.
- English freshwater rivers and canals: chemical indicators of water quality by length 1993-2005. This shows a slight decline in good rivers and a worrying increase in bad and poor rivers over the last few years. See also the next chart.
- English freshwater rivers and canals: bad and poor chemical water quality by length 1993-2005: The same chart as above with the good and fair categories removed. This shows more clearly the significant increase in the bad and poor categories between 2001 and 2004, which showed some reduction in 2005.
- English freshwater rivers and canals: bad chemical water quality by length and region 2000-2005: This chart shows the chemical quality of the worst stretches of river in the country. It shows that most of our "bad" rivers are in the Midlands and the North. There's been some improvement in most regions in 2005, but the Anglian region continues to deteriorate.
- English freshwater rivers and canals: poor chemical water quality by length and region 2000-2005: This chart shows the chemical quality of the second-worst ("poor") stretches of river in the country. It shows increases in poor quality, but some of these are due to decreases in bad river quality in the same regions (i.e. some previously "bad" rivers are now only classed as "poor").
- English freshwater rivers and canals: bad biological water quality by length and region 2000-2004: This chart refers to the worst stretches of river in the country. It shows that most of our "bad" rivers are in the Midlands and the North. It also shows a worring increase in bad biological water quality in four out of seven regions over the last few years.
- English freshwater rivers and canals: poor biological water quality by length and region 2000-2004: This shows that most of our "poor" rivers are in the Midlands and the North. It shows an alarming increase in poor rivers in the Midlands in recent years.
- Welsh freshwater rivers and canals: chemical indicators of water quality by length 1993-2005.
- Northern Ireland freshwater rivers: chemical indicators of water quality by length 1991-2005.
We don't, unfortunately, have comparable charts for Scotland and Ireland. Scotland measures its river quality in a different way and has used three different systems since 1990, so the data isn't comparable. However, you can find the numbers in e-Digest Statistics about: Inland Water Quality and Use and plot your own chart if you wish.
2005
This 15 August 2005 news release from DEFRA updated the picture from 2003.
2003
This 23 September 2003 news release from DEFRA updated the picture from 1999.
1999
The data in this section was compiled in 2001 using data to 1999. We have left it here for interest.
The UK's rivers are under increasing pressure:
- "Only 15 per cent of the UK's 150,000 miles of freshwater channels remain in a "natural condition"... with the remainder dredged and culverted into drainage ditches, straightened and canalised for navigation, or constrained by hard, lifeless banks."
- "Only one acre in 40 of the flood-plain wetlands that once spread over our river valleys has survived centuries of drainage for intensive farming and urban development."
- "One in three UK rivers is colonised by alien plants, and pollution is widespread, from sewage works and factories and poor agricultural practice."
Things are no better in Ireland:
- "The most comprehensive report conducted on Irish rivers, lakes and coastal waters records further evidence of an almost unrelenting decline in freshwater quality, with a third of river channels classified as polluted."
- The report shows: "a distinct trend of continually increasing slight and moderate pollution in rivers but also, especially of late, a reversal of the trend of decreasing serious pollution".
- Rivers show "a very substantial increase in the number being seriously polluted by sewage" - an increase of 29 locations. The most likely cause of this is outdated or overloaded sewage treatment facilities.
- "The worrying increase in pollution of Irish rivers between 1995 and 1997 is mainly due to manures, slurries and excessive spreading of artificial fertilisers which run off into water and cause eutrophication, an enrichment of water."
Source: Irish EPA report, quoted in EnviroLink/Irish Times: "EPA report finds unrelenting decline in freshwater quality" 20 May 1999.
Statistics from 1999
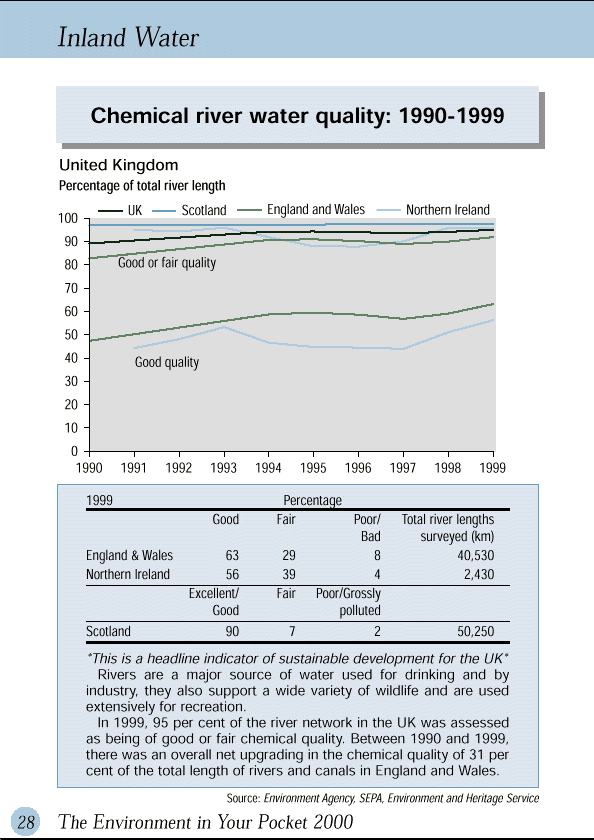
The following statistics come from the useful little booklet The Environment in Your Pocket (January 2001), published by the then Department of Environment, Transport, and the Regions (DETR). They apply only to the UK. We don't currently have comparable data for Ireland.
Inland Water
- Chemical river water quality: 1990-1999
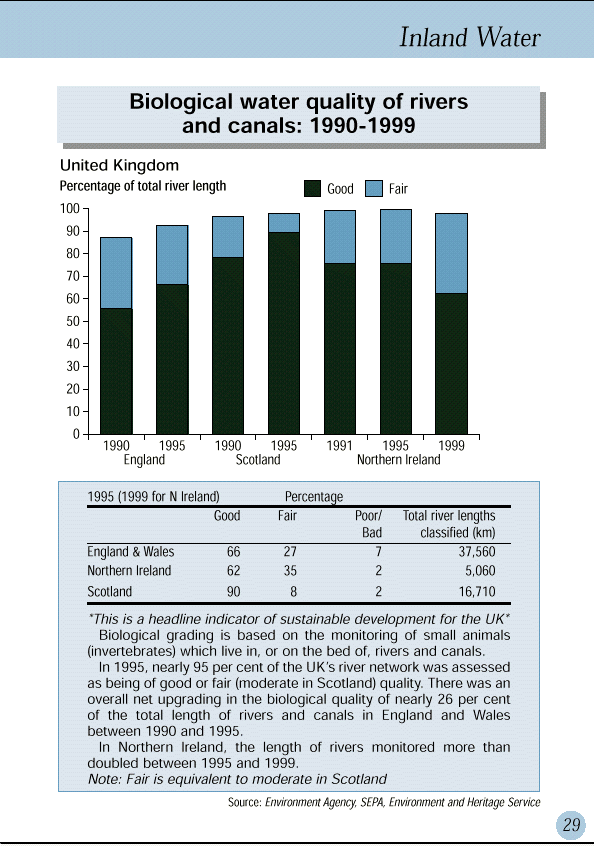
- Biological quality of rivers and canals: 1990-1999
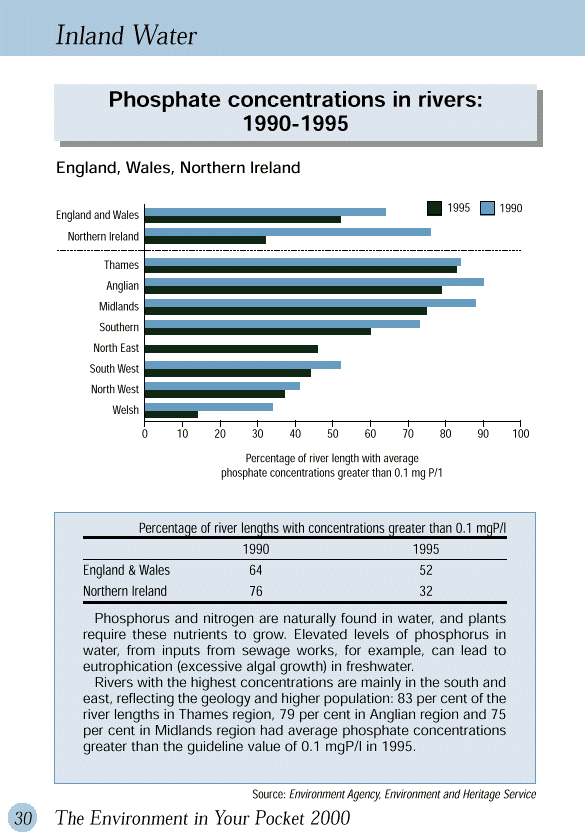
- Phosphate concentrations in rivers: 1990-1995
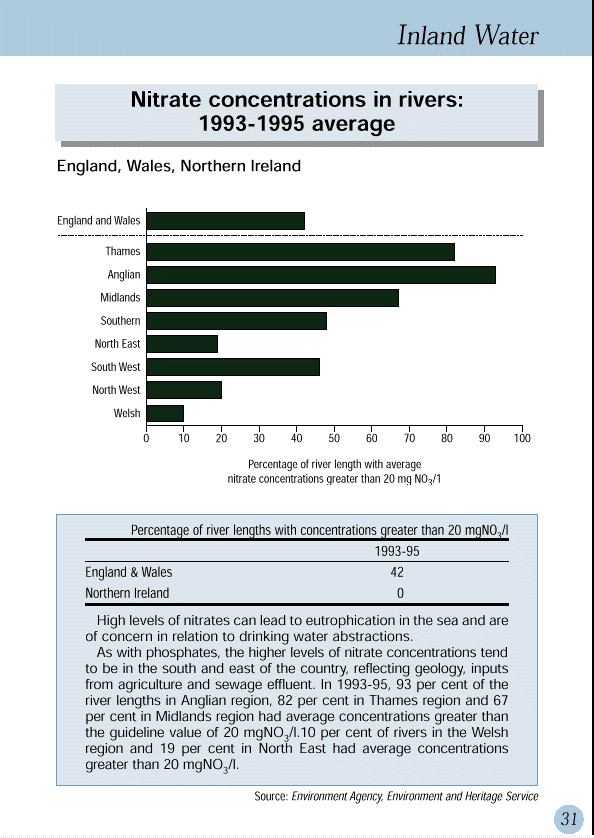
- Nitrate concentrations in rivers: 1993-1995 average
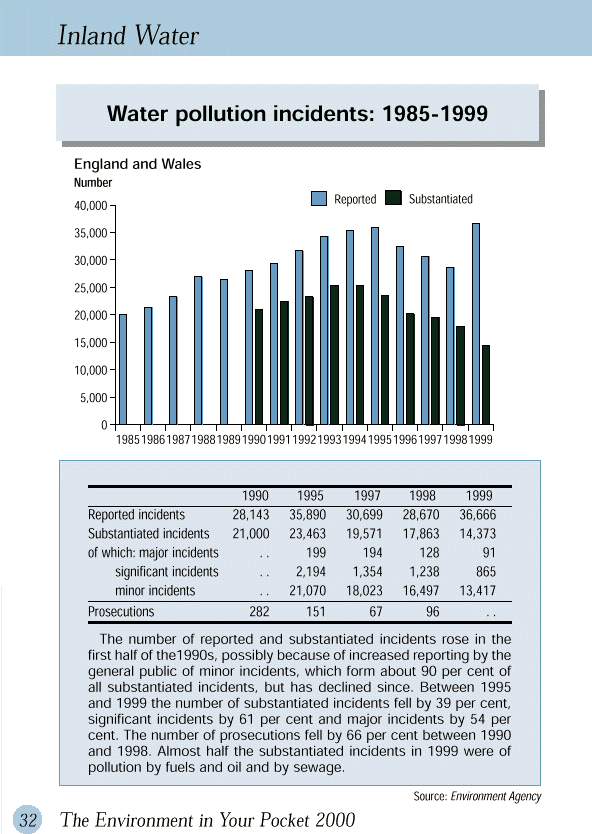
- Water pollution incidents: 1985-1999
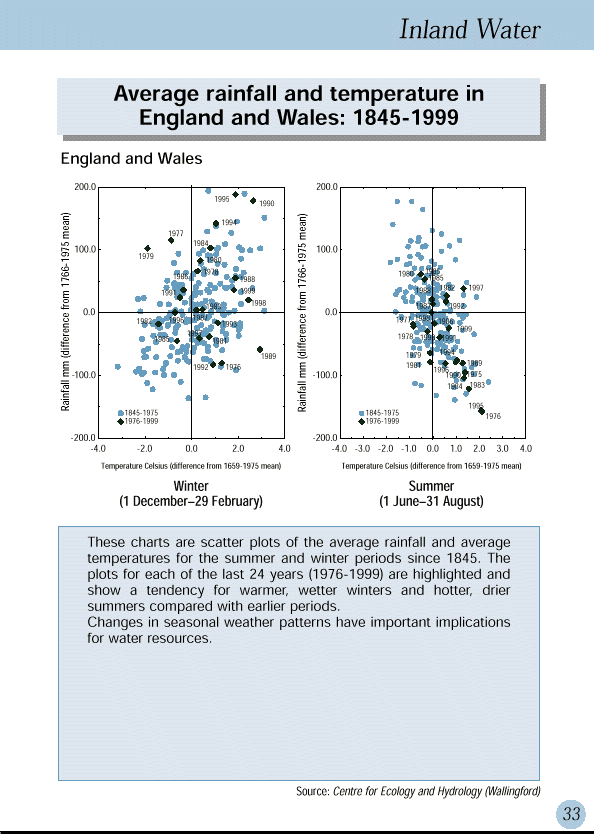
- Average rainfall and temperature in England and Wales: 1845-1999
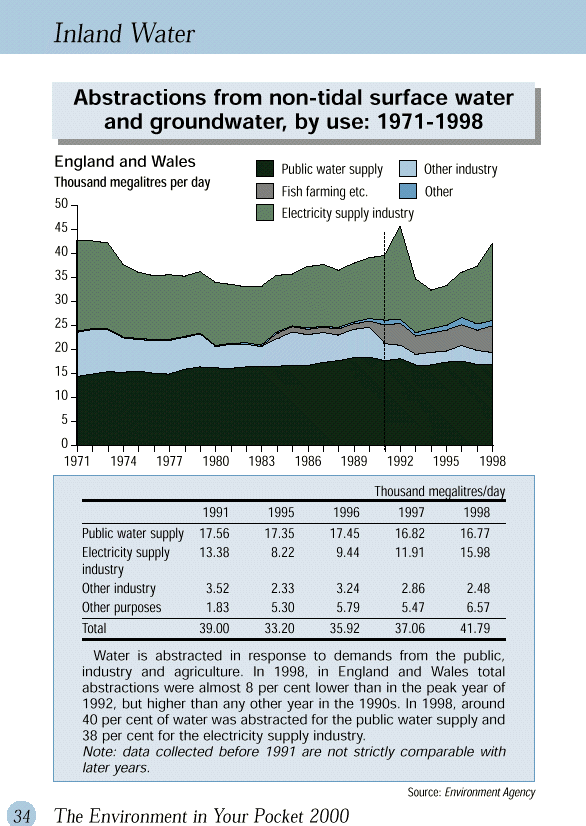
- Abstractions from non-tidal surface water and groundwater, by use: 1971-1998/9
- Water leakage and target: 1994/5-1999/2000
- Drinking water quality: 1992-1999
Coastal and Marine Waters
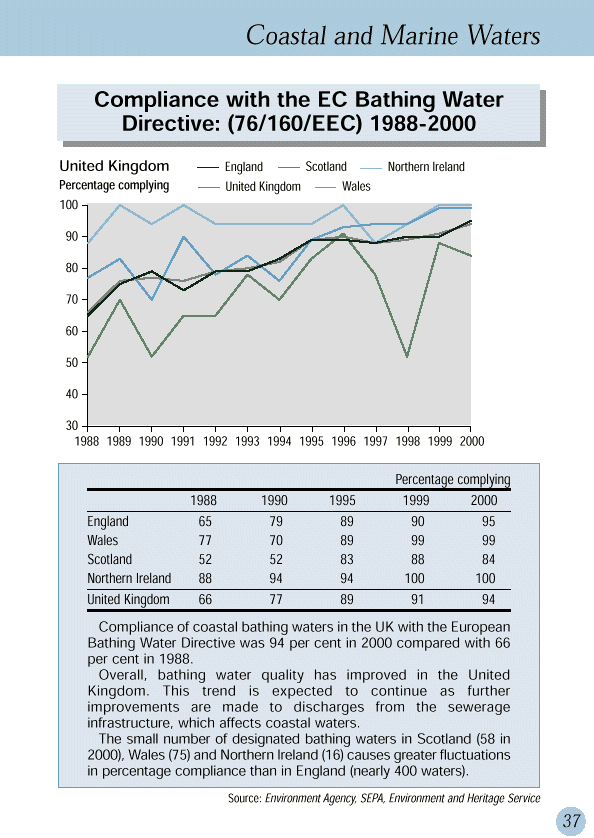
- Compliance with the EC Bathing Water Directive (76/160/EEC): 1988-2000
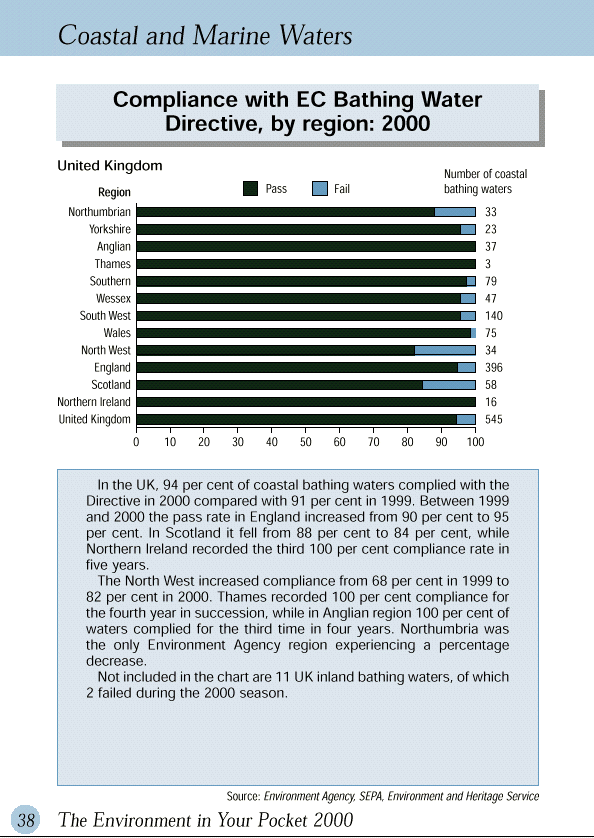
- Compliance with EC Bathing Water Directive, by region: 2000
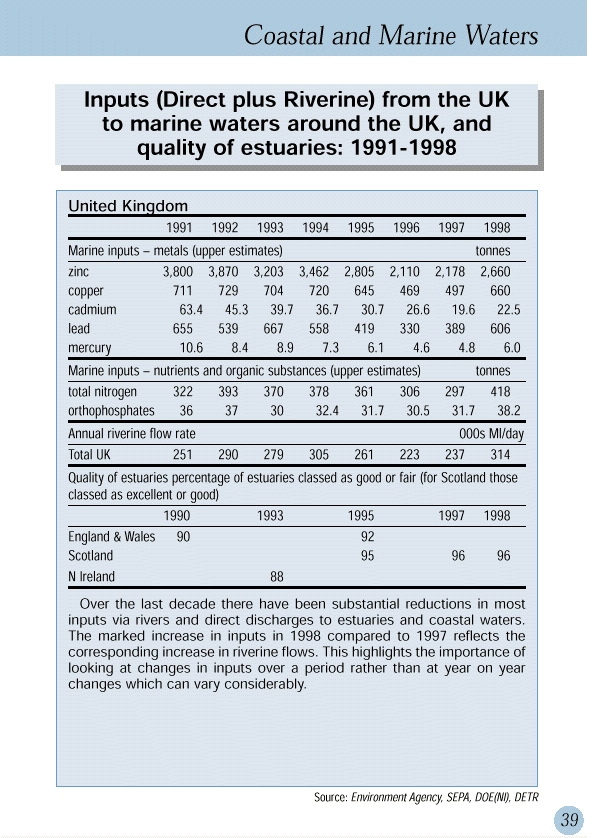
- Inputs (Direct plus Riverine) from the UK to marine waters around the UK, and quality of estuaries: 1991-1998
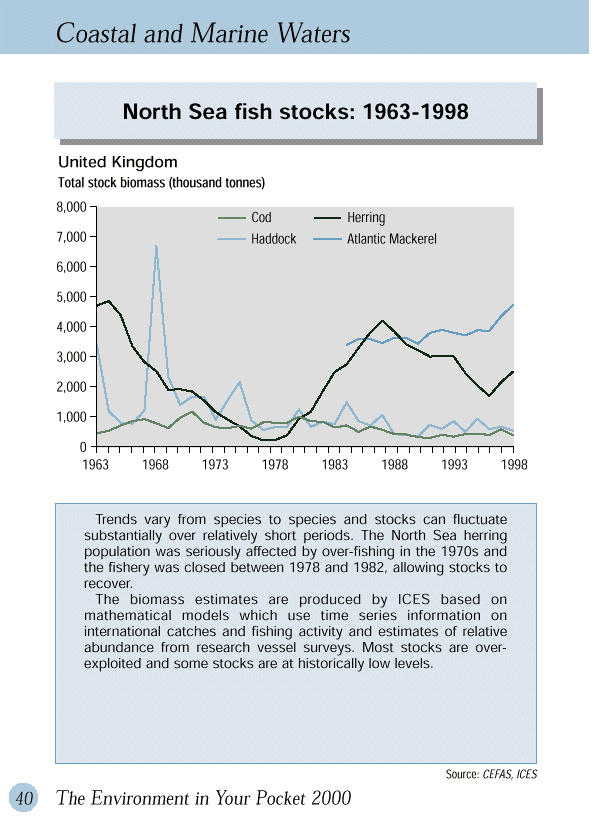
- North Sea fish stocks: 1963-1998
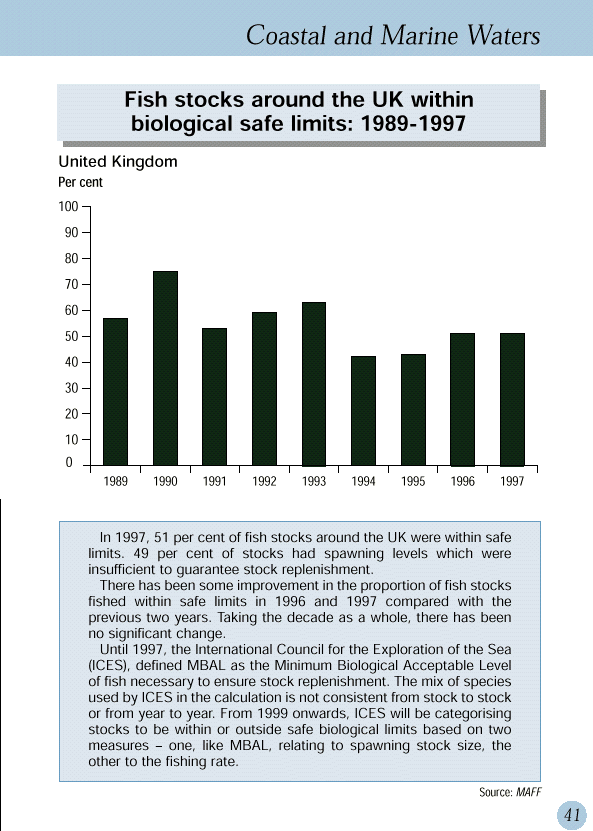
- Fish stocks around the UK within biological safe limits
News stories
- Mersey Cleanest for 200 Years: BBC news report from May 2003.
Other sources
For a detailed look at how water privatization policy led to a drastic degradation in the quality of the UK's rivers in the 1980s, look at The Dirty Man of Europe by Chris Rose, Simon and Schuster, 1990 and Coming Clean: The Politics of Water and the Environment by David Kinnersley, Penguin, 1994. Elizabeth Brubaker's presentation on Water and Wastewater Privatization in England and Wales: An Advocate's Perspective is a good summary covering similar ground.


